I am often in charge of stress testing Fatwire sites for my customers. The tool of the choice for those missions is the wonderful Apache JMeter. In this post I wrote a small tutorial about using it to stress test a Fatwire site.
Well, the site I am going to stress test now is just FirstSiteII, running in a JumpStartKit: not exactly a real-world case. Nonetheless I think the post is both instructive and useful, since the used techniques can be applied on real sites with no changes.
JMeter installation is easy: just download the tarball, unpack it and double click on the jmeter.sh or jmeter.bat launcher script.
Preparing a test is easy as well: you just navigate the site with JMeter configured as a ProxyServer: it will intercept all the requests and create a script that can be run by a large number of parallel threads.
You can create a test manually if you want, but recording browser behavior is faster. So, here is a step by step guide to record a test using a JMeter proxy server.
First, add a Thread group to the Test Plan (it will be the target of our recording): click right button on Test Plan, then Add | Threads (Users) | Thread Group.
Second, create in the workbench an HTTP proxy server (click right button on Workbench, then Add | Non-Test Elements | HTTP Mirror Server).
Now you have a target and proxy server, and you can configure the proxy as in following image:
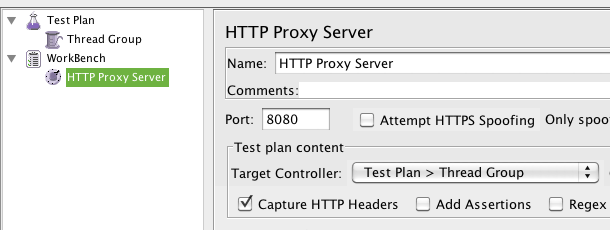
We can see JMeter Listening in port 8080 as a Proxy Server, capturing all the requests and storing them in the Thread Group we created in the Test Plan. Note: change port if you have tomcat in port 8080! I usually have it in port 7001 but it depends on the version of your JumpStartKit.
The Thread Group is the entry point to manage requests that can be run as parallel threads, so it is vital for our stress test effort. We will see more on this later.
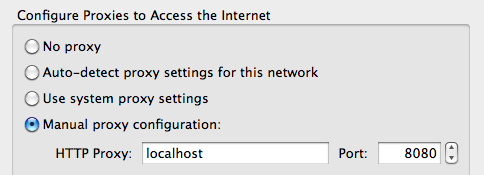
Third, you can configure a Firefox to use JMeter as a proxy server. You can use any other browser, it just happens I love FireFox. See the image below for the firefox configuration; with other browsers you mileage may vary.
Don't forget to remove "localhost" from the "No Proxy" field (that is enabled by default)!
Ok, we are ready. You can navigate the site to record the test. I used First Site II and navigated all the pages in the top menu (without going into the detail page). The result is shown below:
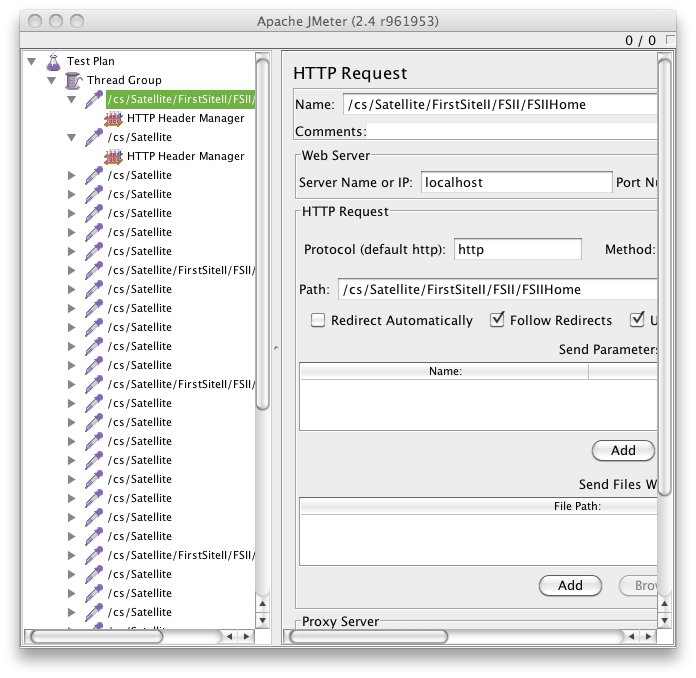
Now, I am almost ready to run a test, but since grouping of results is based on the names of the pages, I decided to separate Blob requests from Page requests. Also I grouped Util call (small elements calls) from full Page requests.
Basically I went through all the recorded entries and I renamed the requests to Page, Blob and Util depending on the parameters.
Now I am ready to perform a stress test. Well, actually I am going to perform a number of stress test with different number of threads (that simulate the number of different users).
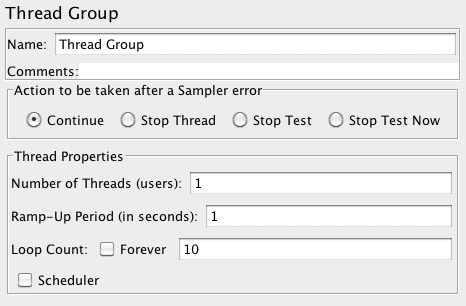
Basically, in a stress test you have to check what is going to happen when there are 1, 5, 10, 20, 100, 1000 users accessing your site at the same time. So what I did is to run the test script changing the number of threads. This is basically just changing a parameter in the Thread Group configuration.
The first test run just with a single thread. It gives a measure of the absolute performance of the site. So I configured the Thread Group as follows:
Running with those parameters gives the following results:
Note that repeating the test usually it does not give EXACTLY the same results but normally they are similar.
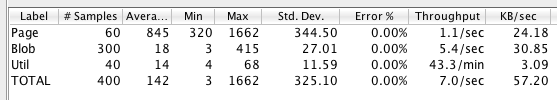
Basically, this test says that with a single user, JumpStart can deliver more or less 1 full page per second and serve up to 7 requests per second (including images and sub elements of a page). Note that a page is served on average in a second.
A single user, accessing a site and opening pages like a mad is not anyway a real model of the real world usage. What we really need to know is what is going to happen where there are more users accessing the site at the same time. So I increased the number of concurrent users.
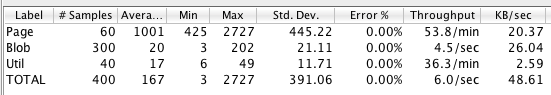
If we try with 5 users we get a better result:
An application server has normally some capacity to handle concurrent request that we are exploiting.
Note the throughput with some concurrent users is higher, 2 full pages and 15 requests served per second, but a single page on average takes 2 seconds to be delivered...
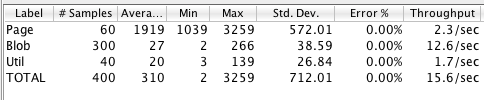
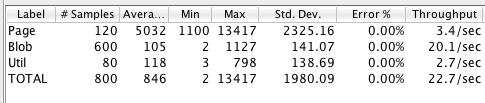
Let's test with 10 users now:
Better throughtput, 3 full pages per second and 2.5 seconds to get on average a full page. This is more or less the optimal result with a single site running on Fatwire Jump Start using Hypersonic SQL as database.
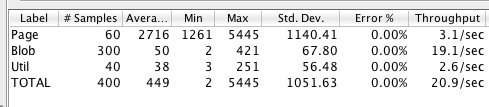
Note that we cannot add users and get better results forever however. With 20 users we don't improve anymore:
Throughput is the same as before (3 pages per second) but the average time to render a page is 5 second! The site is overloaded and is becoming slow.
Let's stress it a little bit more: 40 users!
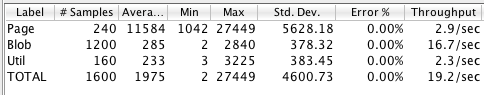
Now, you get even less throughput than before, but you have to wait more to 10 seconds on average to get a page. If you try to navigate the site under stress the user experience is a slow site taking a lot of time to render pages.
Definitely, the site limit of our setup (completely unrealistic however) is around 10-15 users and you need to add Satellite Servers to horizontally scale the site.